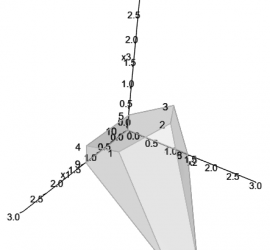
R package gMOIP has been updated to version 1.3.0 and now can plot 3D models too. The package can make 2D and 3D plots of the polytope of a linear programming (LP), integer linear programming (ILP) model, or mixed integer linear programming (MILP) model with 2 or 3 variables, including integer points, ranges and iso profit curve. Moreover you can also make a plot of the bi-objective criterion space and the non-dominated (Pareto) set for bi-objective LP/ILP/MILP programming models. Figures can be prepared for LaTeX and can automatically be transformed to TikZ using package tikzDevice.
Daily Archives: August 8, 2019
1 post

